Warren Buffett Can't Buy These Stocks Anymore.
You Still Can — Here Is How He Actually Got Rich:
The screening method Buffett used before billions made him too big for it — finding companies trading below the value of what they already own, while the market is still asleep on them.
Pull up your portfolio right now. Run your eye down it. An index fund, a few big names everyone owns, maybe a target-date fund quietly matching the market minus fees. It feels responsible. And it is — it's also the exact same thing 90 million other people are holding, earning the exact same average return.
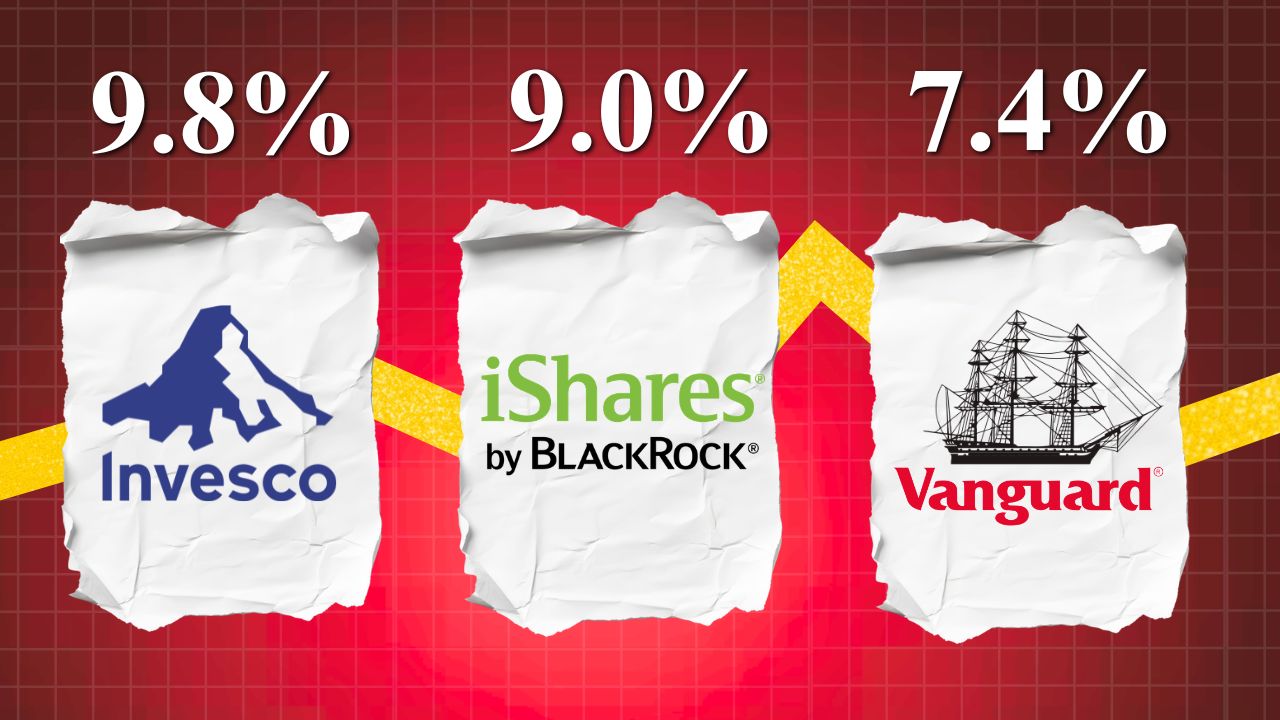
Here is the part nobody tells you: you can index and hold for thirty years, do everything “right,” and still only ever match the market.
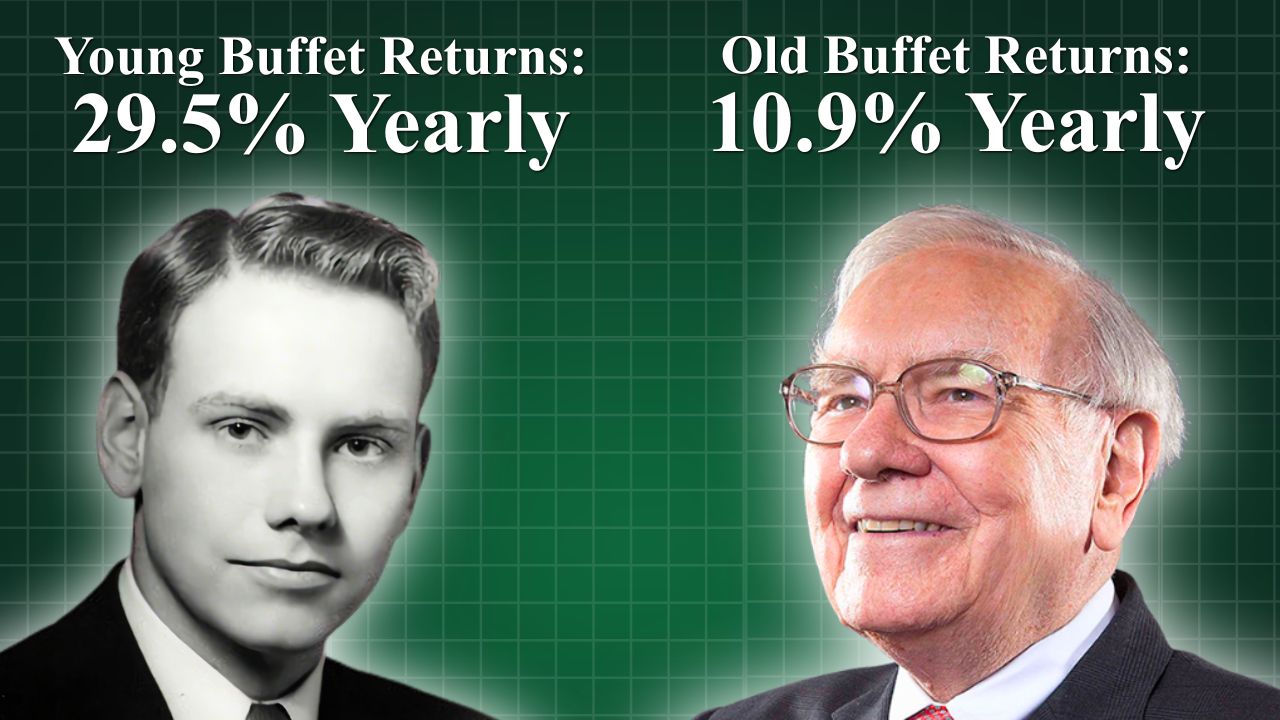
Because the strategy that made Warren Buffett rich in the first place — buying tiny, unloved companies for less than the cash and hard assets on their books — is a strategy he physically cannot run anymore. With $350 billion to deploy, a company that could double is too small to move his needle. He said it himself: “If I was running $1 million, I'd be up 50% a year. It's a huge structural advantage not to have a lot of money.”
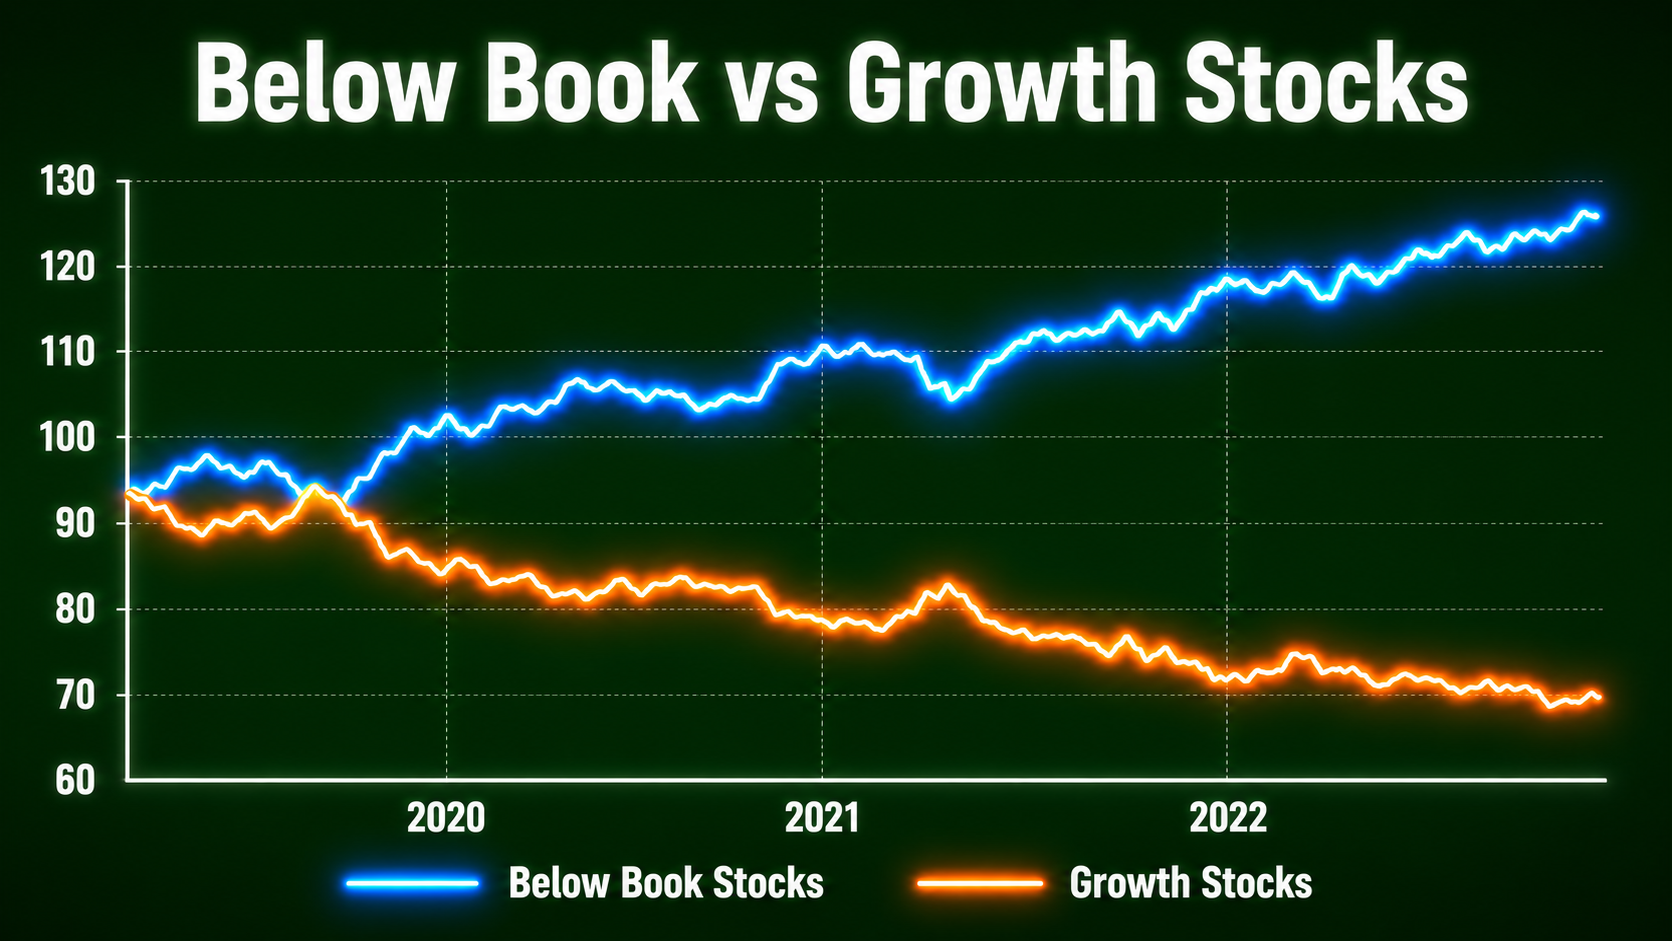
There is a wide gap between what Buffett does now (buy great businesses at fair prices, at enormous scale) and how he actually built the wealth in the first place (buy mediocre-looking businesses at absurdly cheap prices, when they were small enough to still re-rate). The second one still works. It works best for someone small — and the window on any single situation is measured in months, not years.
Why “just buy the index” keeps you average
You've been told to index and chill. You've probably done it. And it hasn't made you wealthy — not because you're doing it wrong, but because almost everyone gets three things wrong about beating it:
- Wrong yardstick for the company. People slap a P/E ratio on everything. But a depressed shipping company, an asset-heavy miner, and a cash-rich net-net each need a different metric — price-to-NAV, price-to-book, net-current-asset value — and almost no one is told which to use where.
- Wrong moment in the cycle. Retail buys a sector after it has already run and the story feels safe. Deep value means buying when the headlines are ugliest and the assets are on sale — the exact opposite instinct.
- No feedback loop. You can't improve what you never grade. Without a way to write the thesis down and score it later, you're guessing and calling it conviction.
Fix those three things in the right order and you stop paying full price for the same crowded names everyone owns. That fix — the exact criteria, the right metric for each situation, and how to grade your own thesis — is exactly what I did in 2020, on live money, in the ugliest corner of the market that year.
This isn't theory — here's what it looked like in 2020
Late 2020. COVID had gutted oil demand, and the entire energy sector was down about 37% on the year — while the S&P 500 was up roughly 15%. Oil tankers, companies that own fleets of physical steel ships, were beaten down even harder. Fear had priced them as if the businesses were about to disappear.
They weren't. So I ran the exact screen the Blueprint teaches across the whole sector, hunting for companies trading below the value of what they already owned. The 7 filters were the same ones in the guide: price down 50%+ on the year, a single-digit P/E, still profitable before depreciation, enough cash to survive 12–18 months, a price below half of book value, low debt, and a young fleet.
About a dozen names cleared the screen and got sorted into tiers. The standout was Scorpio Tankers (STNG): the largest, youngest fleet in the group, trading around $11.46 against a pre-COVID price near $35 — a price-to-book of 0.28, meaning the market was selling the entire company for roughly a quarter of what its ships were worth on paper. Another Tier-1 name screened even cheaper, near 0.21× book. The written thesis laid the recovery math out plainly: if these merely returned to their pre-COVID prices, that was 100–300%+ from the entry.
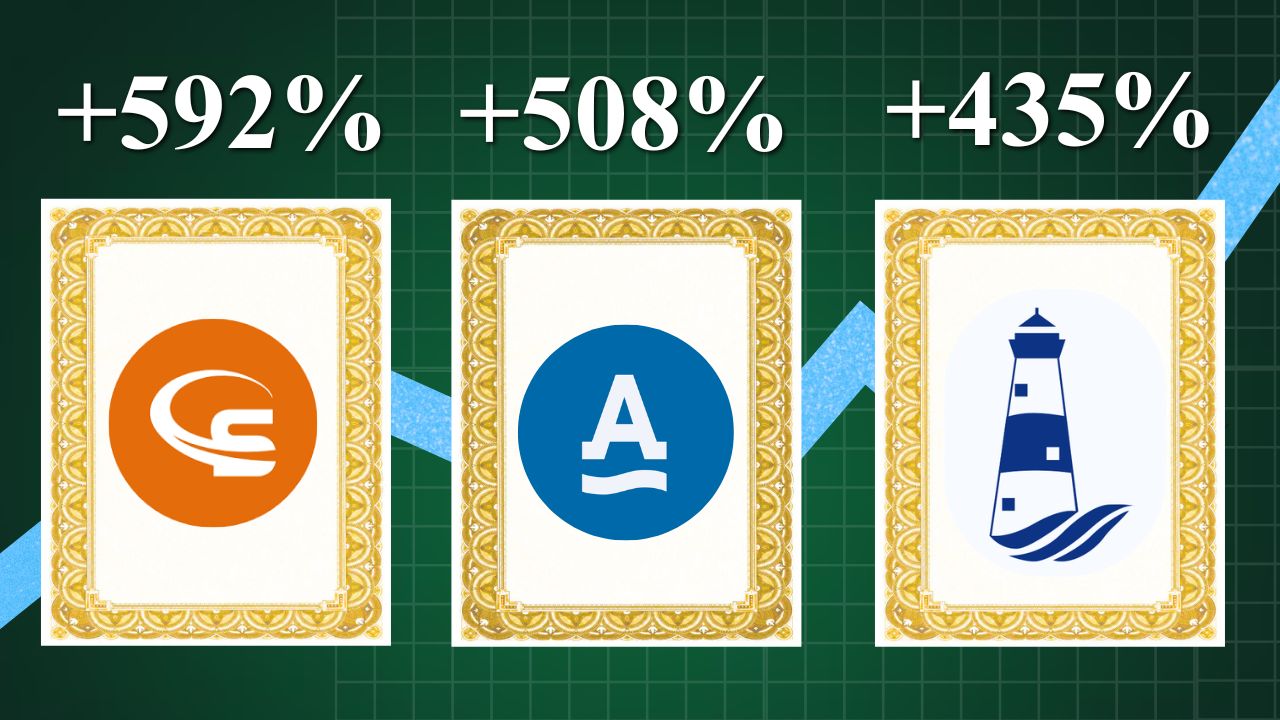
And Scorpio was only the headline. As the sector re-rated off its lows, several of the names the same 7-filter screen flagged that year ran far past the base case — among them Diamond S Shipping, up +592%, Ardmore Shipping, +508%, and International Seaways, +435% from their screened lows. A single screen, run in the ugliest corner of the market that year, surfaced a whole basket of them. These are historical, illustrative results of a past screen — not a recommendation, and past performance is not indicative of future results.
That whole process — the sector setup, the 7-filter screen, the tier ranking, and the company-by-company write-ups — is the 2020 Tanker Report (the optional add-on at checkout, now paired with my honest 2026 post-mortem grading every pick). But the report is just the proof. The Blueprint is the method that produced it — boiled down so you can run it on any sector, in any market. This is one historical example shown for education, not a recommendation to buy STNG or any security today.
Introducing The Below-Book Blueprint
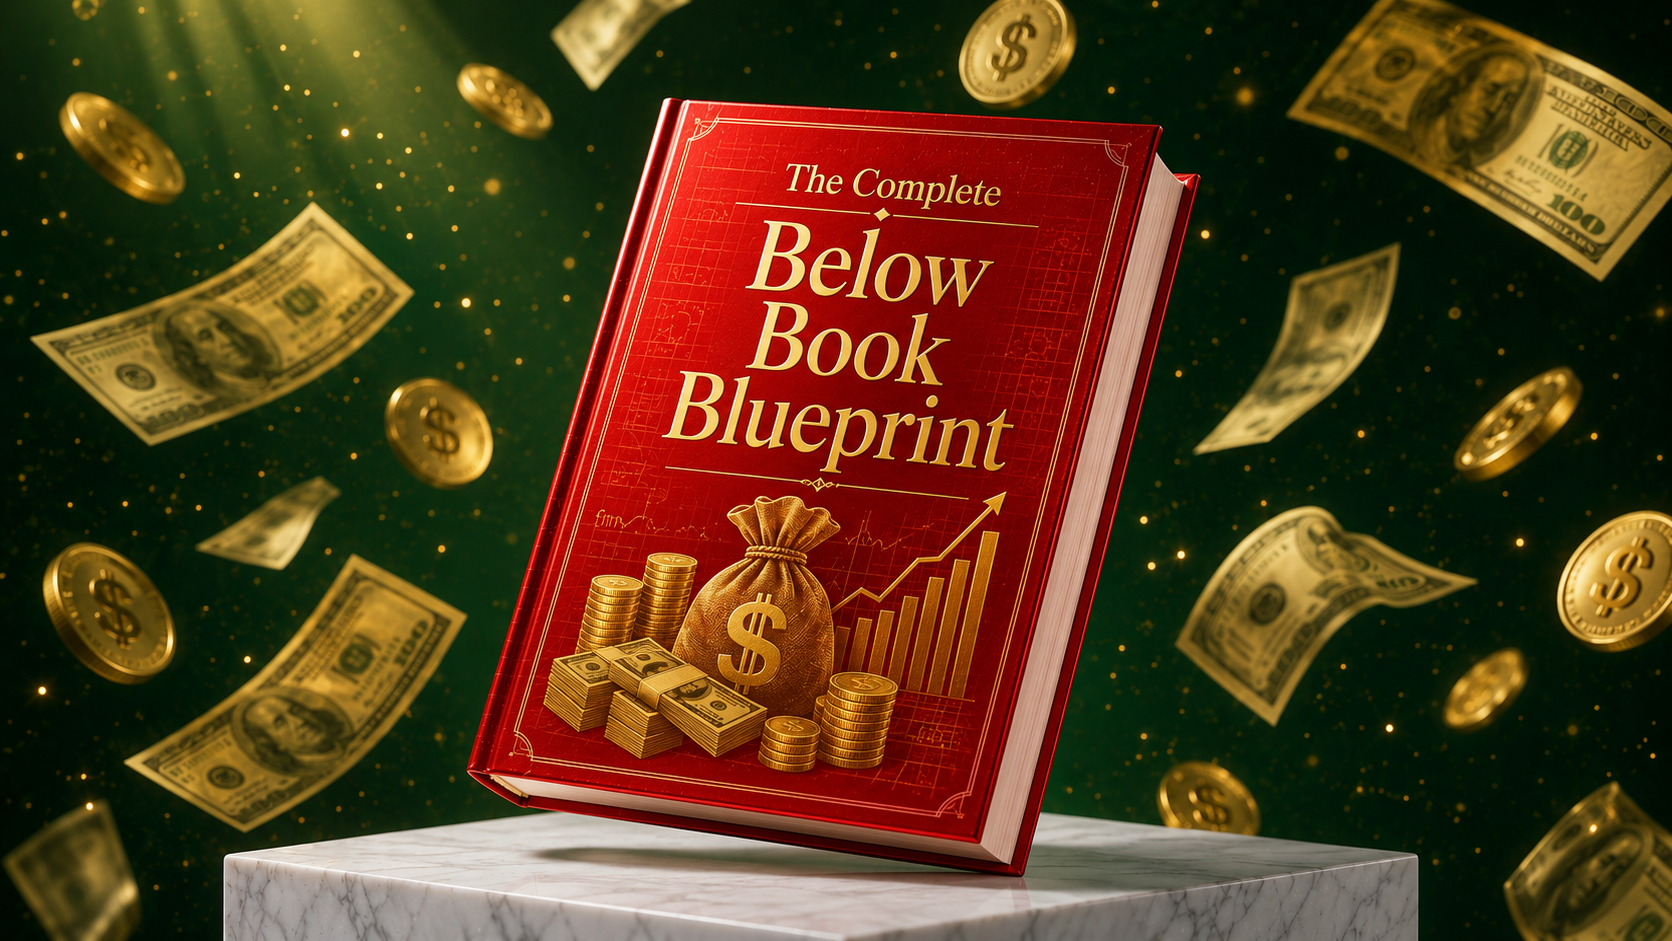
It's not software and it's not a stock tip. It's a short, do-it-this-weekend field guide (read it in one sitting) that walks you through the exact screening sequence deep-value investors use to surface companies trading below the value of their own assets — before the market wakes up and re-rates them.
What's inside the Blueprint
- The 7 Below-Book CriteriaThe exact screen: the balance-sheet, valuation, and cash-flow filters that separate a genuinely cheap company from a cheap-for-a-reason value trap.
- The Cycle Map (the whole system)Where deep value shows up first — depressed cyclicals, out-of-favor sectors, forced sellers — and the order of operations: screen the assets, confirm the cycle low, then size it. Do it out of order and you buy a falling knife.
- The Metric-Matching GuidePrice-to-NAV vs. price-to-book vs. P/E vs. net-net — matched to the type of company in front of you. This one page is the highest-leverage thing in the guide; most people have been using the wrong yardstick for years.
- The Thesis-Grading JournalA simple template to write down why you bought and the price at which you're wrong — then score it later. Proof you can measure, not faith in a feeling.
- “When It's Not Worth The Risk”The honest checklist of red flags — melting balance sheets, dilution, terminal decline — that mean walk away. Knowing what to skip is what protects your capital.
Everything is a research and screening process you run yourself — with your own judgment, on your own account, for the price of a lunch.
Plus a free 1-on-1 Deep Value Strategy Session

Free Deep Value Strategy Session
Order today and you also get a free 30–45 minute 1-on-1 strategy session where we discuss your goals, your experience level, the time you can commit, and whether this methodology actually fits you — so you start with a clear plan, not guesswork.
Normally $97 — yours FREE with the Blueprint today.
Educational strategy session only. We do not review your portfolio or give buy/sell/hold advice on any specific security.
Regular price $49 — today, one-time:
Instant download • Read it in 30 minutes • Session booked after checkout
The “Run The Screen” Guarantee
Read the Blueprint and run the 7-criteria screen for yourself. If it doesn't give you a clear, repeatable process for finding below-book situations — or you're not happy for any reason at all — email me for a full refund within 60 days. Keep the guide. The risk is entirely mine. (I can guarantee the method and the materials. No one can guarantee a market return — and anyone who does is lying to you.)
The math is not close
A single financial advisor charging 1% a year on a $250,000 portfolio takes $2,500 from you annually — forever — to keep you in the same average funds everyone owns. The Blueprint costs $17, once, and hands you the process to find the situations they'll never put you in. Even if it only sharpens one decision a year, it pays for itself many times over — and you stop being the investor holding exactly what everyone else holds.
Secure checkout • 60-day money-back guarantee
P.S. — The reason to start now isn't marketing urgency, it's the cycle. Every deep-value situation has a window: it's cheapest when the news is worst, and it closes the moment the market re-rates it. The people who do the work before the crowd are the ones still small enough to win. Start this weekend.
P.P.S. — Not sure a screening process is worth the effort over just buying an index? That's exactly why the Thesis-Grading Journal is in there. Watching your own written theses play out — and improving them — is more convincing than anything I could claim here.